Ben Haugen, M.S.
Business Development Director – Geohazard Asset Management and Monitoring
[email protected]
Remote sensing technologies (including lidar, radar, satellite and aerial imaging, and others) have been used in the Engineering Geology field for decades. What has changed in recent years is that remote sensing is an almost ubiquitous, if not indispensable, tool for almost every project. From basic initial desktop studies and site investigations to massive infrastructure design and construction projects, remote sensing data can provide critical information that engineering geologists and geotechnical engineers need. In fact, I would argue that not including some form of remote sensing data in nearly every project would, at best, be foolish and at worst, criminal.
You might now be thinking “Hold on – foolish or criminal? Isn’t that a bit extreme?” I agree those are scary words and, for those among us with professional licenses, they could entail serious and even career-ending consequences. So, let’s break this down a bit further…
First, I will say that there is almost no location in the United States where some form of remote sensing data is not already available. Google Earth™ has millions of orthomosiac satellite photographs that cover the entire globe, and, in many cases, it has historical imagery that is used to evaluate the historical site conditions. Thanks to the United States Geological Survey’s 3D Elevation Program (3DEP; https://www.usgs.gov/3d-elevation-program), high-resolution lidar datasets are available for much of the United States and, in many locations (particularly in the Northeast and Midwest) there are multiple years of data collections on file. There are also publicly available lidar datasets for many locations.
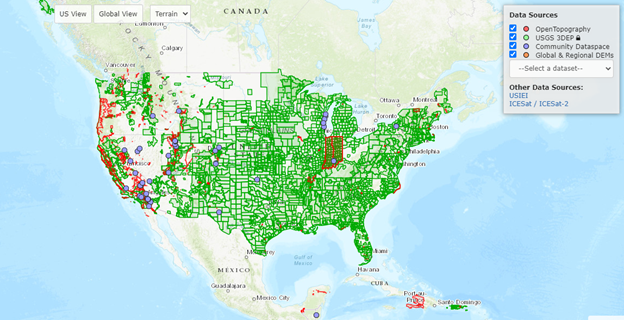
Figure 1. Screenshot from OpenTopography.org that shows lidar and point cloud availability.
Figure 1 is a screenshot from Open Topography (https://opentopography.org) showing availability of 3DEP and other public data from projects funded by the National Science Foundation. There are also thousands of freely available synthetic aperture radar (SAR) images from the Sentinel-1 satellite that can be used to produce current and historical time-series of elevation changes using interferometry (i.e., InSAR). The free InSAR data can be downloaded easily from the Alaska Satellite Facility (https://search.asf.alaska.edu/#/). In addition to publicly available satellite imagery, lidar, and InSAR data, there are many other types and sources of remote sensing data that can be used on your projects.
Second, it has never been easier to collect and process your own remote sensing data. As illustrated in the paragraph above, there are many freely available data sources. There are also many freely available and/or inexpensive data processing software products on the market (e.g., CloudCompare for lidar processing; https://cloudcompare.org/). Furthermore, the rapidly evolving world of unmanned aerial systems (UAS) is making it easier and cheaper to collect high-quality imagery and point cloud data at a local scale. The prices of UAS platforms and sensors have dropped (alongside their size and weight) in recent years, and you’d be hard pressed to find a consulting engineer that didn’t fall in love with their drone the first time they used if for a project. Sensors will get smaller, cheaper, and more accurate and data coverage and community-based data sharing will continue to improve, but it’s considerably easier to take advantage of remote sensing data now than it was even a few years ago.
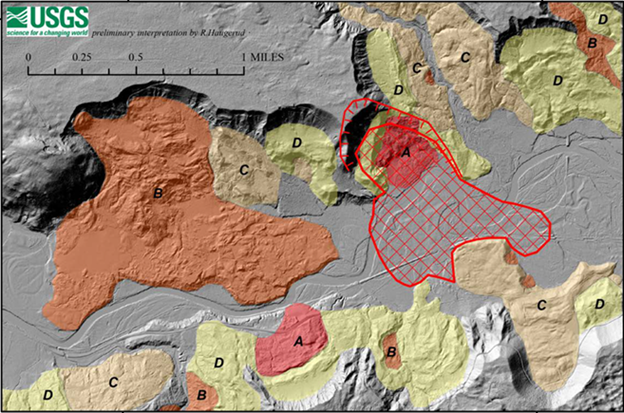
Third and lastly, there can be serious oversights on your project if you ignore the remote sensing data that are available. Hindsight is always 20/20, but a great example of this is the Geotechnical Extreme Events Reconnaissance (GEER) team’s findings from their investigation of the 2014 Oso Landslide (https://geerassociation.org/index.php/component/geer_reports/?view=geerreports&id=30). In this report, it was clear from existing high-resolution bare earth lidar data that the entire Stillaguamish River Valley in which the Oso Landslide occurred was prone to exceptionally large and highly mobile landslides.

Figure 2. Screenshot image from the 2014 GEER report on the Oso Landslide showing bare earth lidar elevation model overlain with the outline and scarp of the Oso Landslide in red and historical landslide features mapped near it in the Stillaguamish River Valley.
Figure 2 shows a screenshot from the GEER report that illustrates the landslides visible in the bare earth lidar data. In the case of Oso, there was no way for the people that established communities to have known how landslide prone and potentially risky building there would be, in part, at least, because bare earth lidar was not available when the communities were established. Furthermore, the shear density of vegetation in the area obscures the details of the ground surface.
Despite being such a compelling story, the Oso Landslide example is an imperfect example because it does not represent what engineering geologists and geotechnical engineers like you and me see every day; we eat and breathe project work and most of it does not involve landslide hazards as severe as Oso. So, I’d like you to recall a project in which you “wished you had lidar data” or “it would have been nice to have historical aerial images.” I’m sure you can think of a few. And now think about how much better, faster, more accurate, and more complete your analysis could have been if you’d known about and been able to utilize remote sensing data.
I suppose the crux of my argument is this: if remote sensing data are available, they should be used because they provide valuable insights that traditional methods may not and not using them could result in oversights that could have serious implications. Plus, these data can be used for geohazard susceptibility modeling, data-driven hazard rankings, and many other things. But I’ll leave that discussion for another day.
Thanks for reading!
